If you are a Budget Leader, Accounts Manager or Admin user in XUNO Purchase Order System, you can view the breakdown of funds in each budget you have permission to view via the My Budgets graph.
Scroll to the bottom of your home page to see the graph.
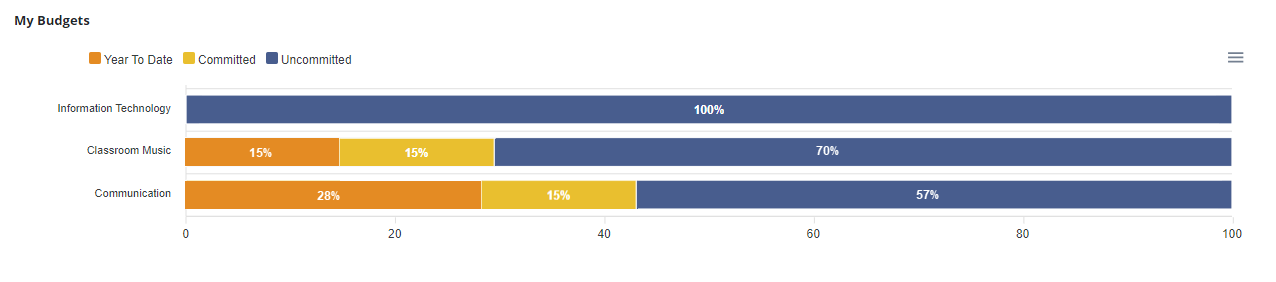
Graph interpretation
Each row of the graph represents a budget. The coloured bars indicate the percentage of funds in each of the following categories:
- Year To Date - this comprises all transactions made in this budget, and is synced from CASES21.
- Committed - the total amount of funds committed to the budget, which includes any order that is beyond Draft status (excluding externally processed orders, and orders which have already been matched up with CASES21 purchase order numbers).
- Uncommitted - the funds still available in this budget.
Viewing details of orders from the My Budgets graph
- The percentages shown are rounded to whole numbers. To see more accurate figures, hover over a portion of the bar to display a popup as shown below:
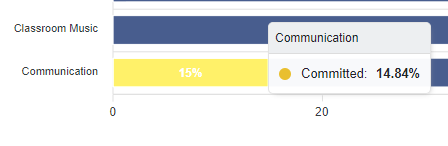
- To see details of all expenditure types, orders and transactions for a budget, click anywhere on the bar for that budget.
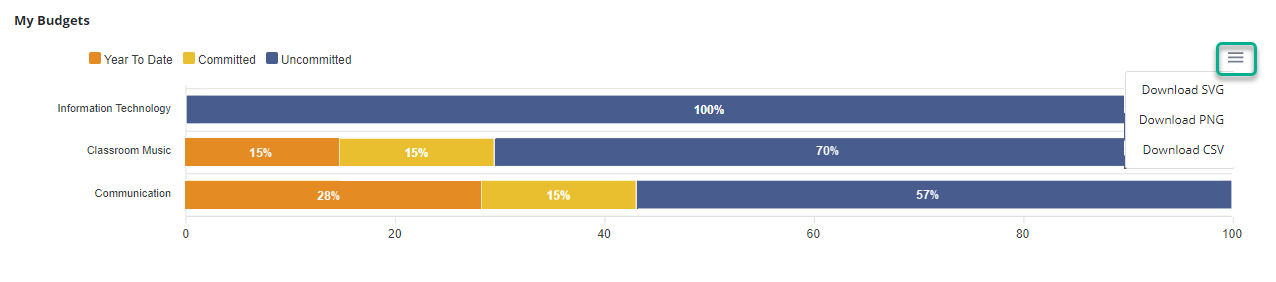
Downloading your My Budgets graph
You can download your graph as a SVG, PNG or a CSV of the data represented by clicking on the three horizontal bars at the top right, then making a selection from the dropdown list.