In this article
What is SWPBS?
SWPBS stands for School Wide Positive Behaviour Support. SWPBS is a program run via the Victorian Department of Education to assist schools in promoting positive behaviours and identifying areas of concern. Although this is a Victorian initiative, the underlying principles are applicable to schools in any State and Territory, whether they are State, Independent or Catholic. Fundamentally, it is an incident analysis initiative. XUNO assists schools running SWPBS by offering a location to store incidents, as well as a powerful analysis tool, which offers instantaneous graphing of data.
The tools listed below are also available for schools not running SWPBS, but who wish to keep track of similar information. Note that the instructions below cover how to store and graph data. For Victorian schools requiring more information on the SWPBS program, contact the Victorian Department of Education.
Pre-requisites
The graphing tool looks at the following areas:
- Type of behaviour
- Level of behaviour (severity of the behaviour)
- Location of incident
- Period when incident occurred
- Who was involved in the incident
- Reasons for behaviour
In order to graph these areas, some fields need to be created before you can begin.
Creating Lists
1. Levels of behaviour
In SWPBS, this is generally divided into Major and Minor behaviours. Other levels may be created if not running SWPBS.
To create levels of behaviour:
- Go to Options > Schools Settings > Lists & Options.
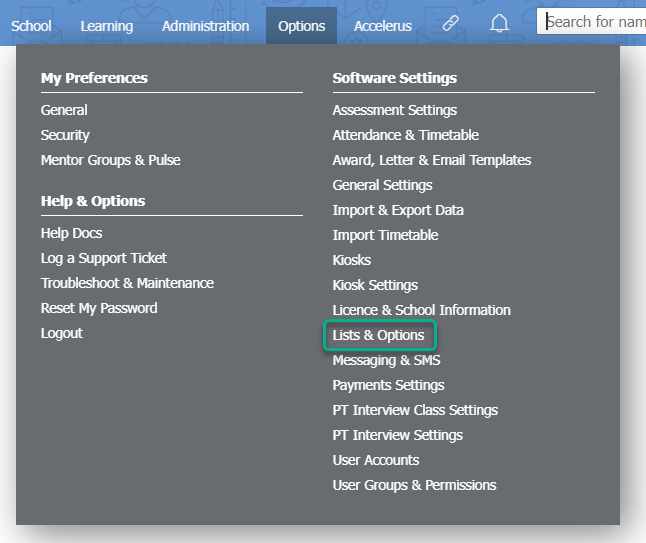
- In the dropdown list, scroll to the Incidents subheading and select Levels (Severity).
- In Add a new item... type 'Major'.
- Click the Add button.
- Repeat the process to create Minor.
- Changes are automatically saved.
2. Location of behaviour
Location of behaviour is a list of possible locations where a behaviour can occur. When creating lists consider any area that you wish to differentiate for graphing and analysis purposes. For example, is it important to know that an incident occurred in the corridor vs. in the classroom? Or is 'Inside' a sufficient location? It is recommended that you initially create a list of areas that first come to mind as areas where incidents commonly occur. Add an 'Other' option which may be used if an area has been forgotten or something unusual occurs (eg student gets onto the roof!). Additional locations may always be added at a later date if analysis of the data shows that a location is a frequent cause of concern.
To create a list of locations:
- Go to Options > School Settings > Lists & Options.
- In the dropdown list, scroll to the Incidents subheading and select Location (Where).
- In Add a new item... type the name of the first location.
- Click the Add button.
- Repeat the process for any other locations.
3. Time Periods - when the behaviour occurred
This can mean a period (in the timetable sense), or even a time of the day. For many schools this would include:
- Before and after school
- Recess and lunchtime
- Class periods
- Between periods, e.g. 'Between Period 1 and 2'
To create a list of time periods:
- Go to Options > School Settings > Lists & Options.
- In the dropdown list, scroll to the Incidents subheading and select Periods (When).
- In Add a new item... type the name of the first period of time.
- Click the Add button.
- Repeat the process for any other periods.
4. Reasons a behaviour occurred
The reasons for which a behaviour occurred are highly varied. However, for the purpose of SWPBS they can be broken into the following reasons:
- Accident
- Avoid Adult Attention
- Avoid Peer Attention
- Avoid Sensory Outcome
- Avoid Tangible Outcome
- Obtain Adult Attention
- Obtain Peer Attention
- Obtain Sensory Outcome
- Obtain Tangible Outcome
- Unknown
To create a list of reasons:
- Go to Options > School Settings > Lists & Options.
- In the dropdown list, scroll to the Incidents subheading and select Reasons (Why).
- In Add a new item... type 'Accident'.
- Click the Add button.
- Repeat for the other reasons listed above.
- For schools not doing SWPBS, type in any reasons you want.
Creating incident types
WARNING: Do not change incidents types already in use. THIS WILL DELETE DATA.
Before creating an incident type, the above pre-requisites must have been completed. An incident type includes the fields that you wish a staff member to fill in when an incident occurs. Each different type of behaviour that you wish to graph must be created as a separate incident type.
Before starting, consider what other information you wish staff to fill in (aside from the lists created in the pre-requisites). Remember that you want to keep it as easy for teachers to fill in as possible, so that they have to enter as little as possible.
If you would like more detail on any of the steps below, please see the information in the article Incidents & Actions: Create custom incident and action types.
To create an incident type:
- Go to Options > School Settings > Lists & Options.
- In the dropdown list, scroll down to the Incidents subheading and select Incident Types (What).
- In Add a new item... type in the name of the behaviour.
- If using demerit points, enter these in Default Demerit Points.
- Lock demerit points as appropriate - normally this is ticked unless you want staff to enter their own demerit points amount.
- In Show in Student General Summary, tick the checkbox if you wish the incident to count towards the total on the Student Summary Panel in their dashboard. For the purpose of SWPBS, tick this checkbox.
- For more information on Student Role Fields, see the related article 'How to enable student role options in an incident type'.
- Do not tick Show Action Fields. (These notes set up actions within the incident type).
- Do not tick Show in Portal.
- Click the Add button.
- This incident type will now appear in the table.
- Repeat for any other incident types.
To modify incident types fields:
- Click the Modify Fields button on the first incident type.
- Any area created in Lists & Options (see above section on creating lists) appear automatically as a field.
- In Field Name, rename any fields to make it clear to staff what you want them to record.
- Tick Required for any fields that you wish to make mandatory for staff to fill in for this incident type. For SWPBS the following fields must be marked as required:
- Severity
- Where
- Why
- When
- Set other checkboxes based on your school choice.
- Move the field up/down via the Position column to reflect the order you wish to see in the incident form.
- Items that you do not wish to use may be hidden or deleted.
- In Add new item... add in any new fields you wish to create. For example, 'Description of incident', 'Actions taken', etc. Follow the normal field creation steps to do this.
- Changes are saved automatically as you click outside the field you are editing.
- Click the x icon in the top right to close the box.
- Repeat for other incident types.
Setting up messaging, alerts and permissions
Set up any notification, emails and alerts as per any other type of incident setup. See the article Automated email or SMS notification alerts to messaging groups for incidents, notes and achievements for more information. Each incident type can have separate permissions assigned to each user group. When you create a new incident type, you will need to edit the permissions for each of your staff user groups accordingly.
Adding incidents
To add an incident:
- Find the student in the search bar and click on their name to go to their dashboard.
- Click on Incidents in the left hand menu.
- Find the type of behaviour and click the Add button.
- Enter the details in the incident form.
- Click the Save button.
Graphing SWPBS data
Generating the graph
Once some data has been added, reports and graphs of this data may be created.
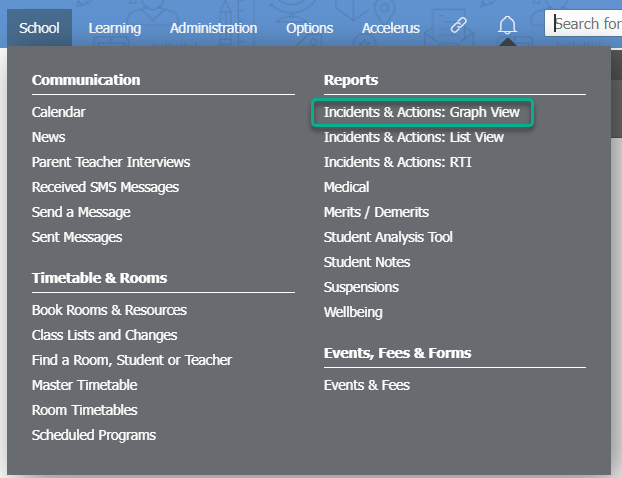
- Go to School > Reports > Incidents & Actions: Graph View.
- Select the date range:
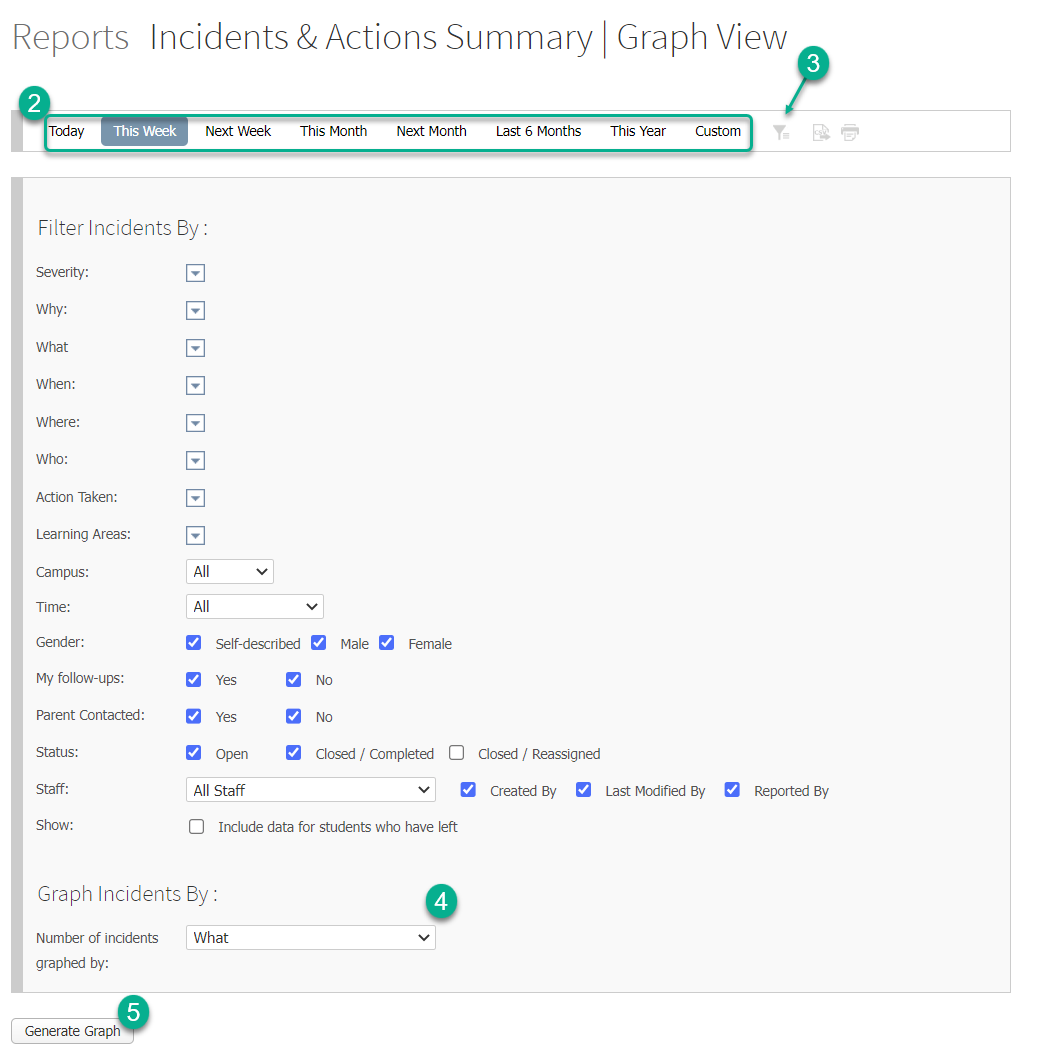
- At the top of the page, choose the date range you wish to graph. Select Custom where you wish to choose a specific range.
- At the top of the page, choose the date range you wish to graph. Select Custom where you wish to choose a specific range.
- Filter specific groups of records:
- Click the filter icon. A table called Filter Incidents By: will appear to allow you to select which incidents to graph.
- Where only specific areas are required, tick the options required from the dropdown lists. If all areas are required, you do not need to tick anything in the dropdown lists. For example, to graph Minor incidents, you can click on the dropdown list for Severity and click Minor. If you don't make a selection in the Severity dropdown list, then both Major and Minor incidents will be graphed.
- Select which category you want to group data by (the y axis)"
- In Graph Incidents By: select how you want the columns displayed. For example, if you want a column for Major incidents and one for Minor incidents, you would select Severity in the Number of incidents graphed by: dropdown list.
- Generate the Graph:
- Click the Generate Graph button.
- This will create a graph underneath the filter box.
Printing the graph
To print the graph, simply click on the Print icon in the date selection bar. You may like to click on the filter icon before printing to hide the filter selection box.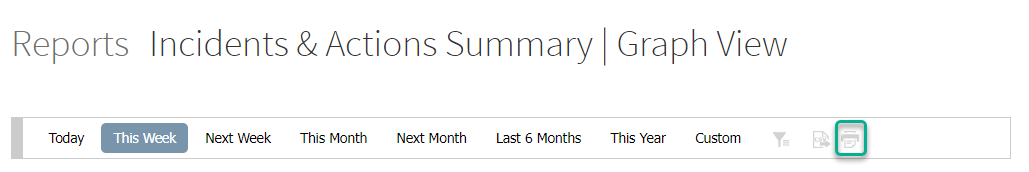
Exporting data
To export the summary table as a CSV file, click the Export icon in the date selection bar. This will export the summary table only.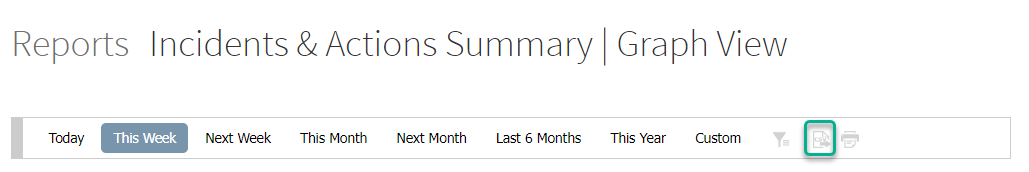
Viewing statistics and details
Below the graph, you will see a summary of each column graphed, including the number of incidents as well as the percentage of incidents this represents overall. Further insights may be gained by clicking on a bar in the graph to see the related incidents.
To see a specific incident:
- Click on the bar you wish to view further information about.
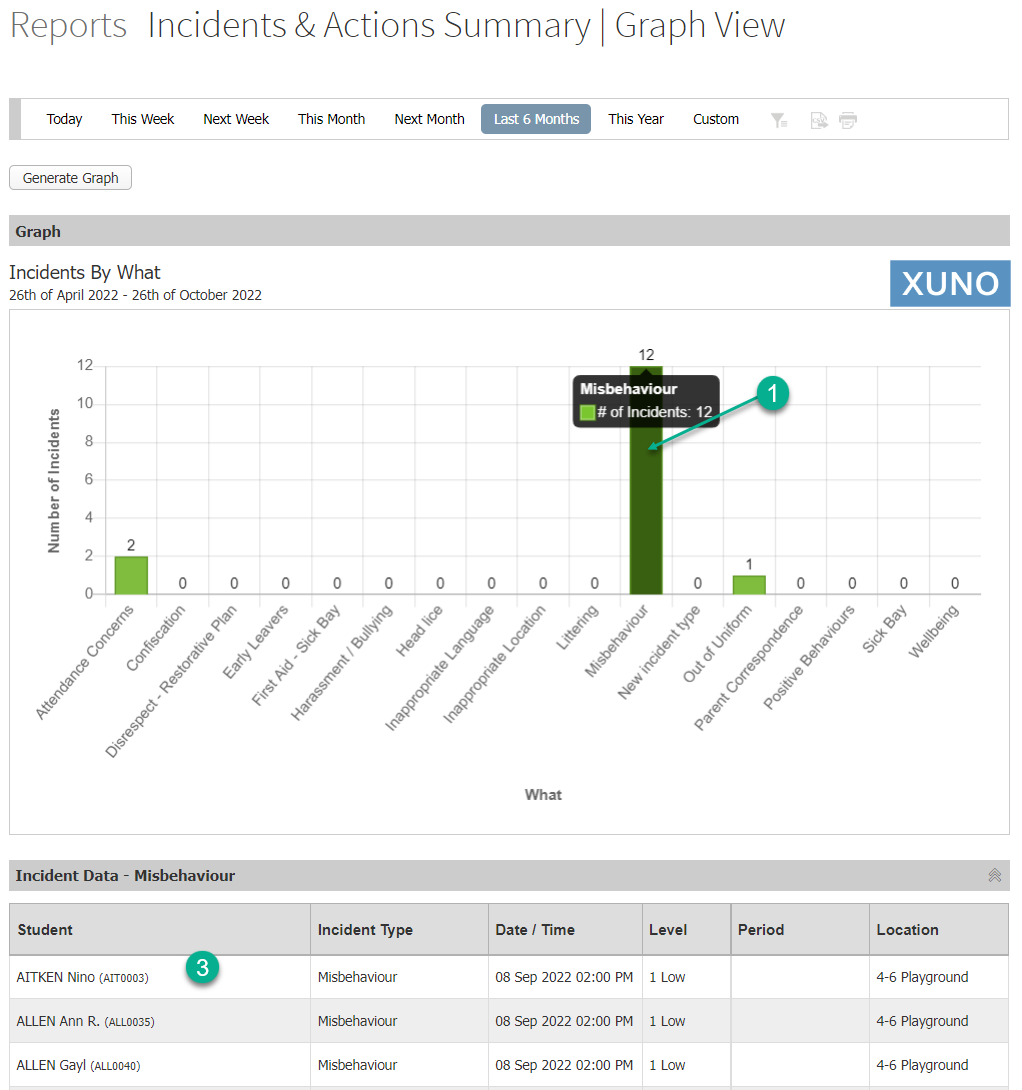
- Underneath the graph an Incident Data table will be displayed. This will show:
- Student name and code
- Incident Type
- Date / Time
- Severity level
- Period
- Location
- For further details, click on the specific incident in the Incident Data table to bring up the specific incident and all the relevant information entered. This will show as a popup box. Click the x icon in the top right to close the popup.
To reset the graph
Click the Generate Graph button to return to the initial screen, or just refresh your browser window.