![XUno logo White with border.png]](https://docs.xuno.com.au/hs-fs/hubfs/XUno%20logo%20White%20with%20border.png?height=35&name=XUno%20logo%20White%20with%20border.png)
Before you can print a map or graph data, you need to select which columns of data you want to include in the printout or to graph.
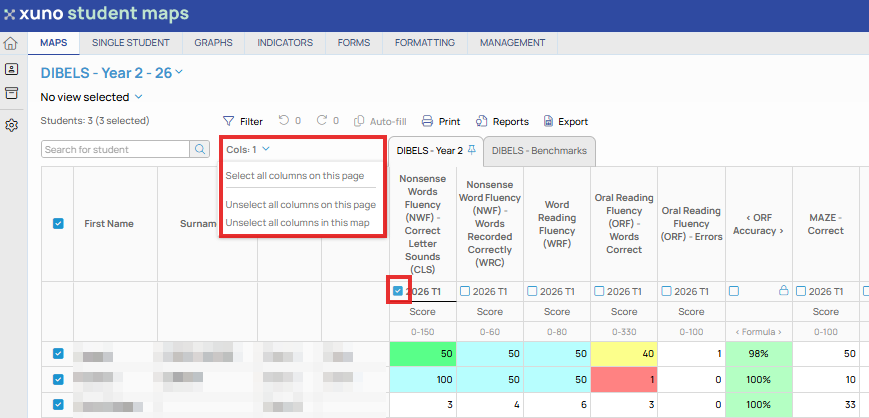
• Select a column by clicking anywhere in the column selection cell.
• A selected column then shows a ticked checkbox.
• You can unselect that column by clicking again in the column selection cell.
• You can select any column on any page in the current map, except for comments and attachments columns, which cannot be graphed.
• You can also unselect all columns in the current map page or across all map pages in this map by clicking the Selections drop-down and choosing Unselect all columns on this page or Unselect all columns in this map.