![XUno logo White with border.png]](https://docs.xuno.com.au/hs-fs/hubfs/XUno%20logo%20White%20with%20border.png?height=35&name=XUno%20logo%20White%20with%20border.png)
By double-clicking on any map in the list of maps, you can edit that map layout by adding new pages or columns of data, reordering pages or columns, updating result types to display in maps and more. 26 All map layout functions are performed in this screen. You can also edit map layouts in the connected GradeXpert desktop application, as they are shared between the 2 systems.
• When the map to edit is highlighted, either double-click the map name or click Edit in the toolbar to being editing that map layout.
Collapse or Expand Map
A student map can contain up to 20 pages, or tabs, of data. Each page can contain any number of columns. You can create as many maps as you like.
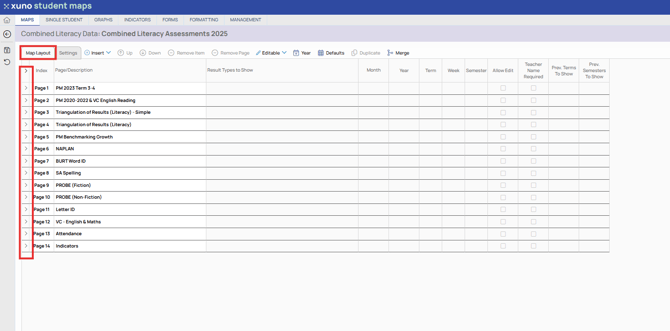
If a map contains many pages, it may be easier to modify the layout after collapsing all pages and only expanding the page you are working on. Collapsing a map will only display page names, not the assessments on that page.
• You can collapse the whole map in one step by clicking Collapse on the toolbar. This will then hide all the selected assessments so only the page names are displayed.
• You can also collapse single pages by clicking the down arrow to the left of the page name.
• You can expand the whole map in one step by clicking Expand, which will then display the contents of each page.
• You can also expand single pages by clicking the right arrow to the left of the collapsed page name.
Merge Map Layouts
You can merge map layouts so that all pages and columns from one map are added to the map layout you are currently editing. The original map you are merging from is left intact, but all pages and assessments etc. from the original map are appended to the current open map layout.
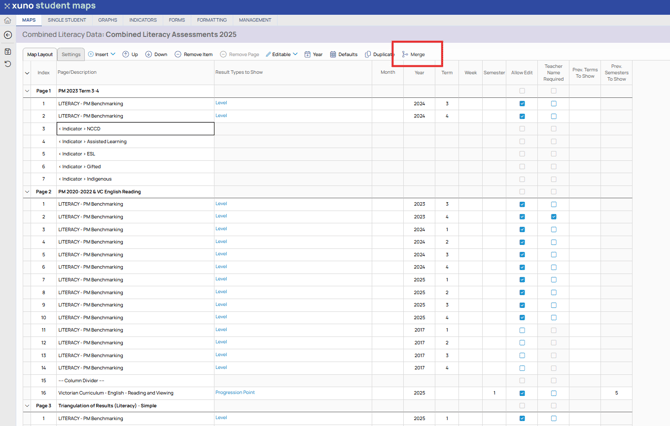
- Open the map you want to add another map layout to (i.e. merge).
- Click Merge
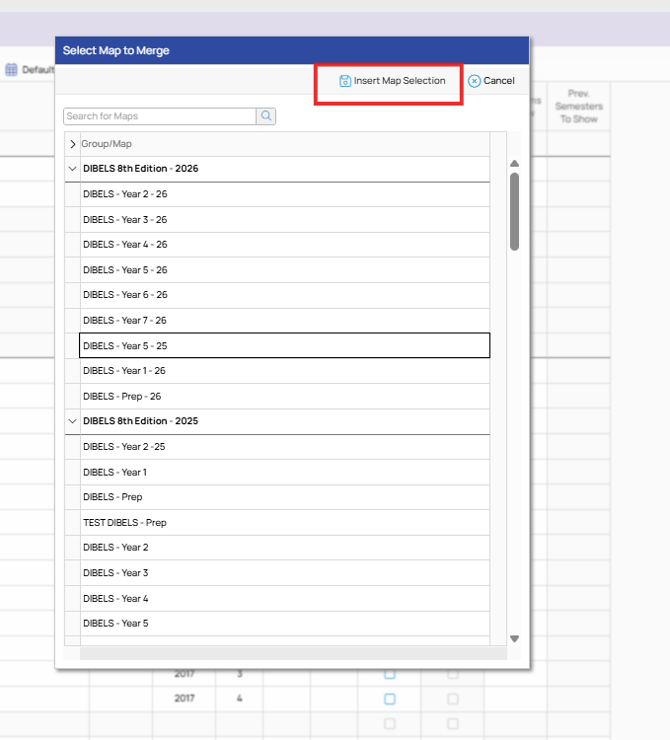
- Select the map whose pages and assessment you want to append to the current map layout. You won’t be able to select the current map layout, as you cannot merge a map into itself.
- Click Insert Map Selection.
- All pages and columns from the map selected above will then be appended to the existing pages in the current map. The original map you are merging into this one will be left untouched and can still be used. As maps can only contain a maximum of 20 pages each, you will be alerted if the combined number of pages exceeds this limit.
- You can then save the merged map layout.
Insert Items into a Map
Each page or column in a map can be added by clicking the Insert drop-down list above the map layout screen. Map columns (i.e. sets of assessment data or attendance data, comments etc.) can only be added under a map page (or tab) name. You cannot have columns in a map that are not part of a page.
Insert Page
Each map can contain up to 20 pages. Each page can contain an unlimited number of columns but must contain at least one column.
• To add a new page to the map (always added under the currently selected row), click Page from the Insert drop-down.
• This will add a new page with a default page name of “New Page 3”, for example.
• You can edit the page name by typing over the default page name (or any page name) in the page description column (i.e. to the right of the page number cell).
• You can split large pages by selecting the row in the page below which you want to split the page, then click Page from the Insert drop-down menu. This will add in a new page at that position, and any assessments below that newly inserted page will be included on the new page.
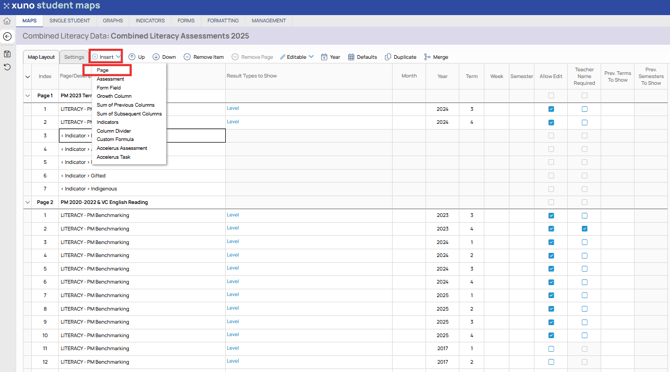
Insert Assessment
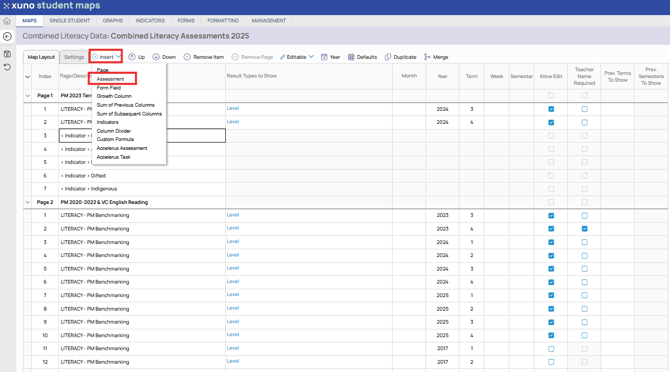
Adding an assessment column to a map layout can be done by clicking Assessment from the Insert drop-down. When adding an assessment column, you must also specify which result types to include, the date options (e.g. 2023 term 1), and whether the column of data can be edited or is view-only.
• To add an assessment to the map (always added under the currently selected row), click Assessment from the Insert drop-down.
• If the Assessment option is disabled, this means you need to first add a page, or select an item in an existing page so that the assessment column is inserted in the correct position.
• You will then be able to select one or more assessment types from the list shown, which contains all the assessments that exist in your student maps database. This can be assessments with data already entered, or assessments with no data at all. • You can search for assessments and collapse or expand assessments under their assessment headings.
• Once the assessment(s) you want to insert in the current position are ticked, click Insert Selection.
• The selected assessments will then be added to the map layout at the current position in the page.
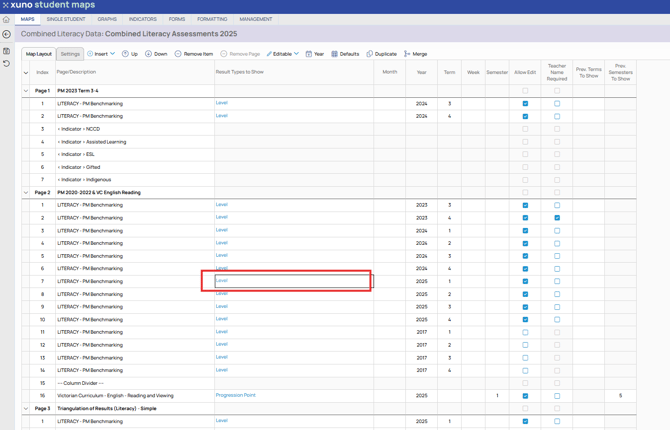
• You can then select the correct result types to show by double-clicking on the Result Types to Show cell.
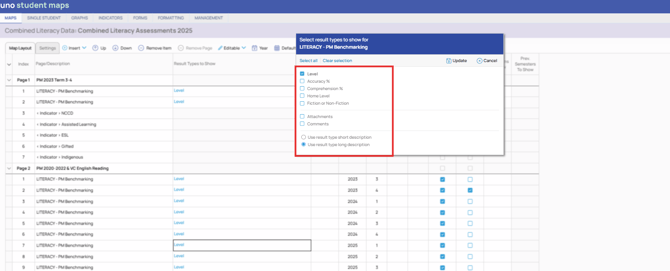
• If there are multiple result types set up for this assessment (for example, PAT Reading may have a scale score, stanine and raw score), tick the result types you want to use in the map.
• If this assessment has also been set up to allow comments and/or attachments to be added (set up in the GradeXpert desktop application), you can tick or untick either of these two additional options.
• The final map will then set up each of these result types and/or comments/attachments as separate columns in the map after the result type columns.
• You can select and deselect result types, comments or attachments to display at any time during map setup. If you remove a column, the data is not removed as well, just the view of that set of results in the map. You can add the column back in at any time if needed.
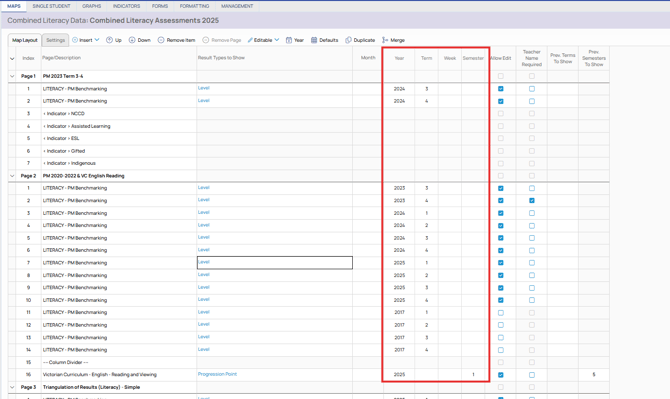
• For each row in the map, you need to specify when the data is for, e.g. 2023 Term 1, or 2022 Term 2. Select the correct year from the drop-down in the Year column, and then select the desired term, week, month and/or semester. For most results, we recommend either a term OR semester, not both.
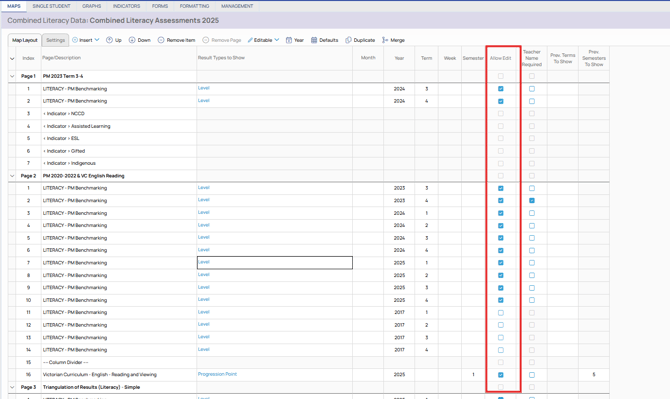
• Note that changing any of these date options when data has already been entered will cause that data to no longer be displayed, as the date options that the map is loading will be different to the date options the data was originally saved with. For example, you may have reading data for 2022 Term 3, and you then change the date options in the map layout to be 2022 Semester 2. The original results are saved as 2022 Term 3, so will not be displayed when changing to 2022 Semester 2. • You can then also specify whether this new column of data can be edited or if it is read only. Usually, data that is imported from other sources, such as NAPLAN or PAT imports, must never be changed, so ensure the “Allow Edit” is unticked. You can also prevent editing of previous years or semesters data by unticking this option for those columns.
• Any column that requires teachers to manually enter data into the map, like a mark book, must have the “Allow Edit” ticked.
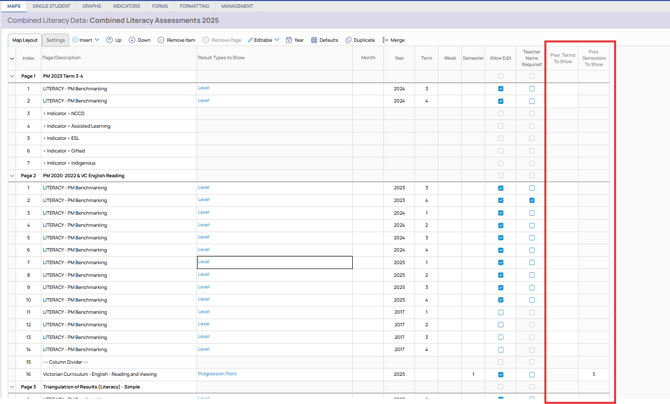
• You can also automatically include previous terms or semesters results for the current assessment. For example, if you have added a Maths assessment for data from 2023 Term 2, you can place a “2” in the Prev Terms to Show cell, which will then add in 2 columns before the current one, showing Maths data from 2022 Term 4 and 2023 Term 1. If you have specified a Term in the “Term” column, then only the Prev Terms to Show will be available. If you have specified a Semester in the “Semester” column, then only the Prev Semesters to Show will be available. This is a shortcut option, as you can achieve the same outcome by adding in these columns manually and specifying the actual years and terms/semesters to include. '
Insert Growth Column
A student map can automatically calculate the growth (difference) between any two test results. A growth column must be preceded by the two test results columns you want to display growth for.
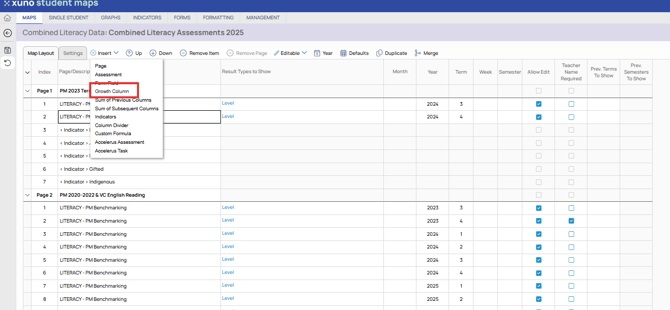
• Adding a growth column to a map layout can be done by clicking Growth from the Insert dropdown.
• Growth columns cannot be the first column on a page, it MUST be preceded by 2 columns showing only the results to calculate the difference (growth) for.
• For example, add a column that uses a Maths test (select one result type only, e.g. percentage score) for 2023 term 1, and then add another column immediately after that for the same assessment and result type, but for 2023 term 2. Thereafter, add the growth column so you see 3 columns of data, i.e. score from 2023 term 1, score from 2023 term 2 and growth (difference) between the two.
• You can specify any assessment, any result types and any date ranges (e.g. NAPLAN 2021 to 2023) to show growth for.
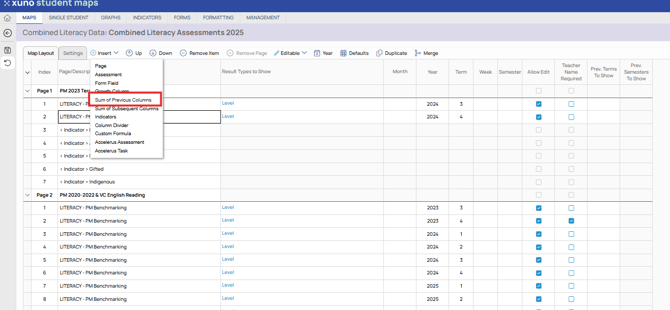
Insert Sum of Previous Columns
A student map can automatically add up any row of results and display the total value in a column. This is often used when a set of skills is set up in a map, and outcomes can be “Achieved” (with a value to graph of 1) and “Not Achieved” (with a value to graph of 0).
When the map displays this column, it will add up the value to graph (or the actual value in the cell if numeric) for all columns prior to this column on the current page in the map and display that total.
• Adding a Sum of Previous Columns column to a map layout can be done by clicking Sum of Previous Columns from the Insert drop-down, AFTER the last assessment column you want included in the total.
• This column does not have to be right at the end of a map page but should be at least 2 or more columns into the page.
Insert Sum of Subsequent Columns
A student map can automatically add up any row of results and display the total value in a column. This is often used when a set of skills is set up in a map, and outcomes can be “Achieved” (with a value to graph of 1) and “Not Achieved” (with a value to graph of 0).
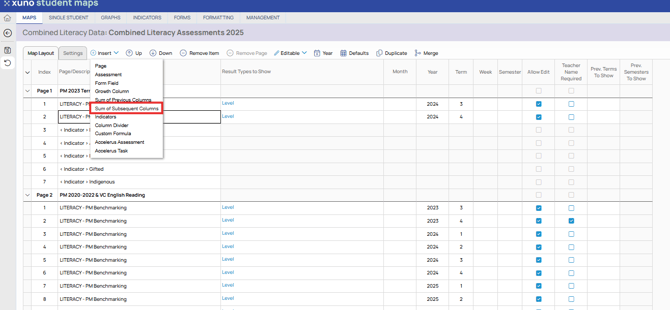
When the map displays this column, it will add up the value to graph (or the actual value in the cell if numeric) for all columns after this column on the current page in the map and display that total.
• Adding a Sum of Subsequent Columns column to a map layout can be done by clicking Sum of Subsequent Columns from the Insert drop-down, BEFORE the first assessment column you want included in the total.
• This column does not have to be right at the start of a map page but should be before at least 2 or more columns on the page.
Insert Indicators
Indicators in Student Maps are like Custom Alerts in Xuno. These are customisable categories that you can attach to students so that you can easily identify and filter students in any of those categories. You can add student indicators to a map so that you can see these indicators when viewing the map itself.
You can add individual indicators, e.g. NCCD, which will only show NCCD indicators assigned to students, or you can add an indicator group, which will show all indicators in that group that have been assigned to any student in your map.
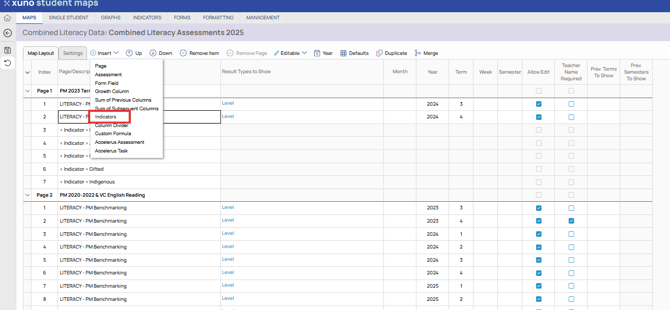
• Adding an indicator column to a map layout can be done by clicking Indicator from the Insert drop-down.
• The list of available indicators, grouped under indicator headings, is then displayed.
• You can tick individual indicators to include by ticking the box to the left of the desired indicator. This will create a new column in the map at that location that will display that indicator description for each student who is assigned to this indicator. If a student is not assigned to this indicator, then that cell will be blank for that student.
• You can add multiple indicators at any position in a map by selecting multiple indicators at once.
• You can also add all indicators within an indicator group by ticking the “Any” box to the right of that indicator group (or header). This will disable the individual indicators within that group so they cannot be selected (as we’ve just said include all indicators in this group).
• Ticking Any will create a column in the map for each indicator within that group where at least one student in the list is assigned to that indicator.
Insert Column Divider
Adding a column divider allows you to visually group similar results together on a map page.
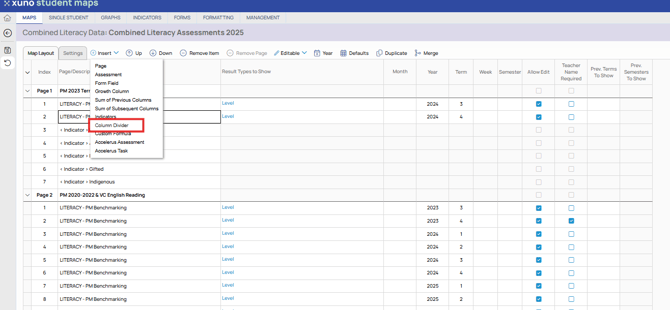
• Adding a column divider to a map layout can be done by clicking Column Divider from the Insert drop-down.
• A new row in the map layout will be added at the current position, showing Column Divider as the type of item to display. • A column divider will show a thicker vertical dark grey line at that position in the map to allow you to group similar assessments or dates together more easily.
• You can add as many column dividers as you like to make your maps easier to view.
Insert Real-time Attendance from Xuno
The option to include real-time attendance data in Student Maps is only available if you are also using the Xuno school management system. These attendance setup options in Maps setup are only available if you access Student Maps from Xuno, not if you log in to Student Maps via the Student Maps login screen.
Note that you can also always import attendance data from any other school management system that can export attendance data. This type of attendance data will be set up as an assessment called “Attendance”, with result types of Attendance Rate, Days Absent, Days Late etc., based on the type of attendance data that your school management system can export.
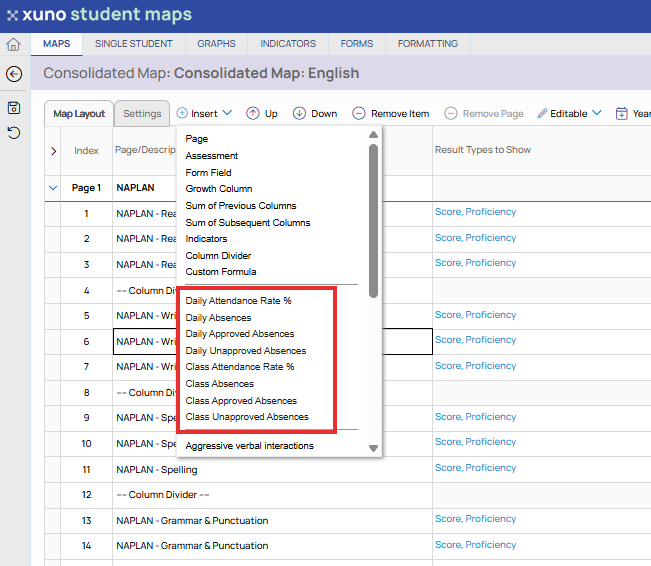
• Adding real-time attendance data to a map layout can be done by clicking one of the Daily or Class attendance options from the Insert drop-down.
• Once you have selected an attendance type to include, you must then specify the year of attendance, as well as an optional term, week and or semester of attendance to include.
• The daily attendance details will show the attendance rate per day and number of days absent.
• The class attendance details will show the attendance rate per class and number of classes absent.
Insert Real-time Incident Count from Xuno
The option to include real-time incident data in Student Maps is only available if you are also using the Xuno school management system. These incident setup options in Maps setup are only available if you access Student Maps from Xuno, not if you log in to Student Maps via the Student Maps login screen.
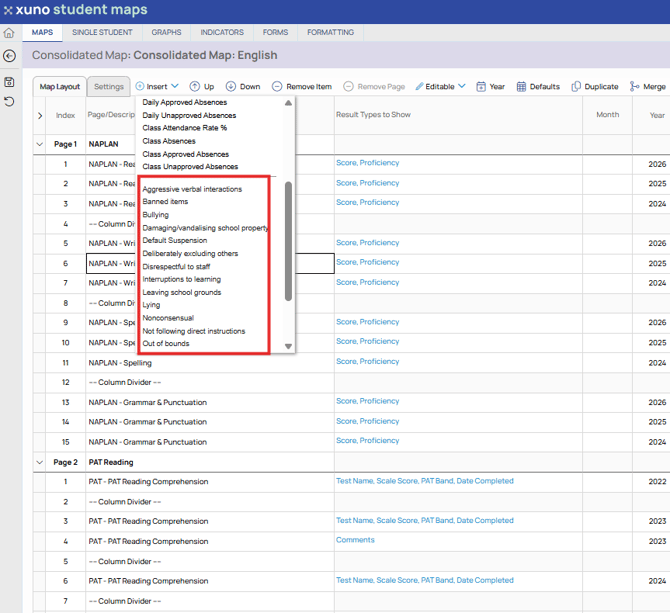
• Adding real-time incident counts to a map layout can be done by clicking one of the incident types from the Insert drop-down.
• If this incident type has been set up to allow you to specify the student role, e.g. perpetrator, victim, or bystander, you’ll be able to select the role type to include, usually just the perpetrator.
• If no student roles are used for the selected incident type, then the total number of incidents for each student for the specified period will be displayed in the map.
Remove Item
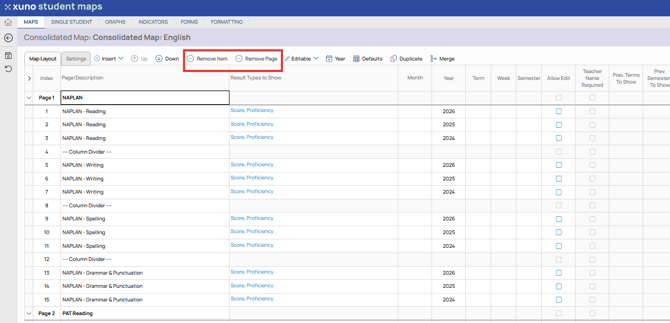
• If you have added an item (e.g. assessment, column divider etc.) to a map and you want to remove it from the map layout, click on the row in the map layout to remove and click Remove Item. This will remove the row from the map layout.
• Clicking Remove Item on a page name will only remove that page name, not the individual assessments in that map page. To delete a page and all assessments on that page, click Remove Page.
• Note that removing an item (row) does not delete any data. The saved assessment data can be seen again if you add a row back into this map (or any other map), specifying the same assessment and date options. This is because the assessment data is not actually stored in the map, it is saved one against the student in the database. The map is just a view to the saved data.
Remove Map Page
• The long way to removing a page and all items on that page is to click once on the page name, click Remove Item, then click Remove Item on all items on that page, one at a time.
• The short way to removing a page and all items on that page in one step is to click on the page name in the map layout screen, and then click on Remove Page.
• This will remove both the page name row (i.e. tab name) and all items on that page in one operation.
Move Columns or Map Pages
You can easily re-order columns within a map page, or even entire pages.
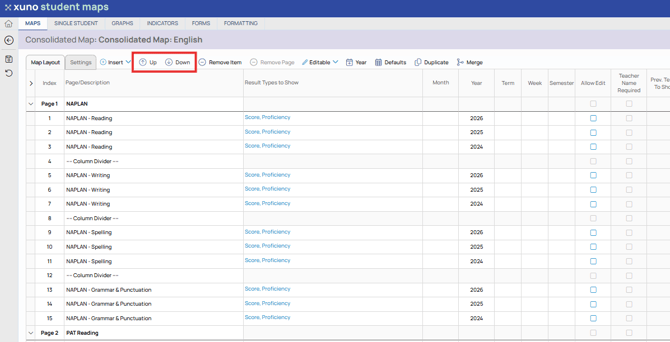
• When editing a map layout, and you want to change the order of columns on a page, click on an assessment row (not a header row) and click Up or Down. That row will then be moved one row up or down.
• If the row being moved gets to a page name, then this row will be moved into the new page.
• If you want to change the order of entire pages within a map, click on a page name (not an assessment row) and click Up or Down.
• That entire page, including all items on the page, will then be moved one page up or down, i.e. the map tab will be moved left or right when viewing the map.
Set Columns to Editable or Read-Only
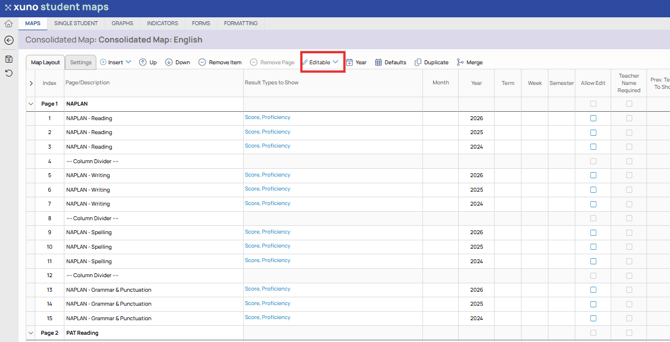
Each column in a map can be set to read only or editable.
• Usually, data that is imported from other sources, such as NAPLAN or PAT imports, must never be changed.
• To allow staff to make changes to data in this column, ensure Allow Edit is ticked for that row in the map layout.
• You can also prevent editing of previous data by unticking this option for those columns.
• To prevent staff from making changes to data in this column, endure Allow Edit is unticked for that row in the map layout.
• If there is no checkbox option visible in a map layout row, then this item is not editable under any circumstances, such as calculated results, real-time attendance, or incidents.
Increase Year
It’s easy to re-use your existing maps in subsequent years. One of the easiest ways of setting this up is to simply increase the year shown in the current map by one year, i.e. change 2022 to 2023. This is usually done at the end of a year, in preparation for the next year.
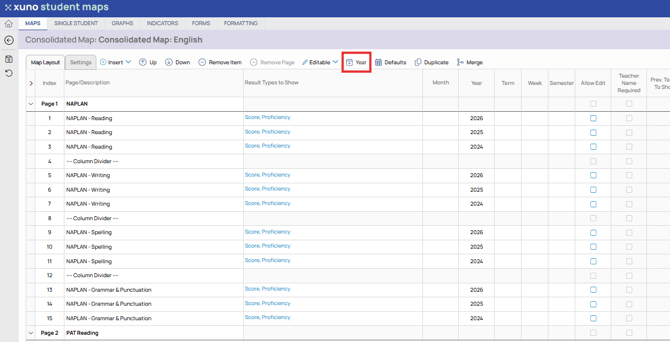
• To increase the years shown in the Year column by one year, click the Year button.
• You will be prompted to confirm this change, and after answering Yes, all years shown will be increased by one.
• For example, assessments for 2022 term 1 will be changed to 2023 term 1 (week, month, term and semester are not changed). • This is a shortcut to updating years, alternatively you can manually change the year in the Year column to the desired year.
Defaults
If you want to apply the same date options to a range of rows in one operation, this can be done through the Defaults option.
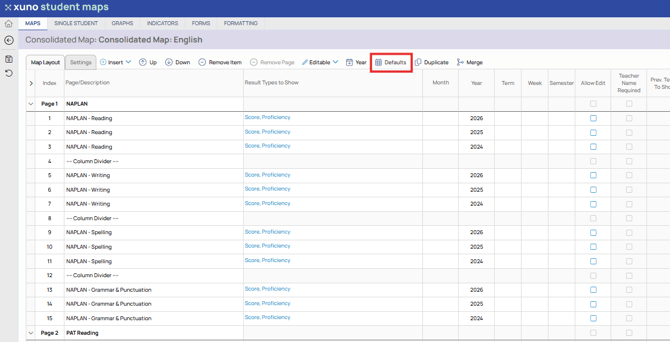
• Click Defaults, and you will be shown a popup where you can set a default year, term, week, month and/or semester.
• Set the values you want to apply to all assessments on the current page or the whole map, by selecting the month, year etc. from the drop-down lists.
• If you want these date options to be applied to all assessments in the current map layout on all pages, click Apply to all.
• If you want these date options to be applied only to assessments on the current page, click Apply to page.
Duplicate Items and Pages
You can make a copy of any page in a map without having to recreate a copy from scratch. You can also duplicate a single row in a map layout instead of selecting the same assessment again and the same or similar date options.
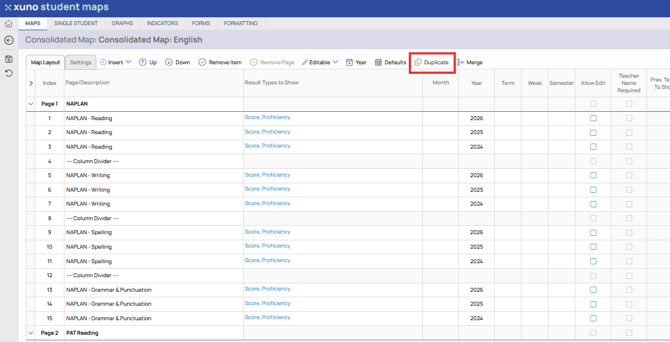
• To duplicate an existing map page and all items on that page, click on the page name, and then click Duplicate.
• A new map page will be created (as long as it doesn’t exceed the maximum number of 20 pages per map). All the same assessments and date options will be copied for each item on the original page.
• The duplicated page name will need to be renamed as you cannot have two pages with the same name.
• To duplicate a single row, click on the row to duplicate and then click Duplicate. This will insert a copy of the current row in the next available row. You can then modify the date options on that row to match what data you’d like to see.