![XUno logo White with border.png]](https://docs.xuno.com.au/hs-fs/hubfs/XUno%20logo%20White%20with%20border.png?height=35&name=XUno%20logo%20White%20with%20border.png)
You can create new map layouts and edit existing map layouts in Student Maps. This allows you to create new maps and make changes to your existing maps, such as adding new pages and assessments to a map, reordering map columns and pages, changing assessment date options (e.g. from 2022 term 1 to 2023 term 1) and more.
Creating and modifying map layouts is an administrative function, so should only be done by Student Maps administrators at the school. This function is not intended to be used by all staff members, otherwise any map can be created or modified by any user, resulting in a possible loss of consistency of assessment data across the school.
Display List of Current Maps
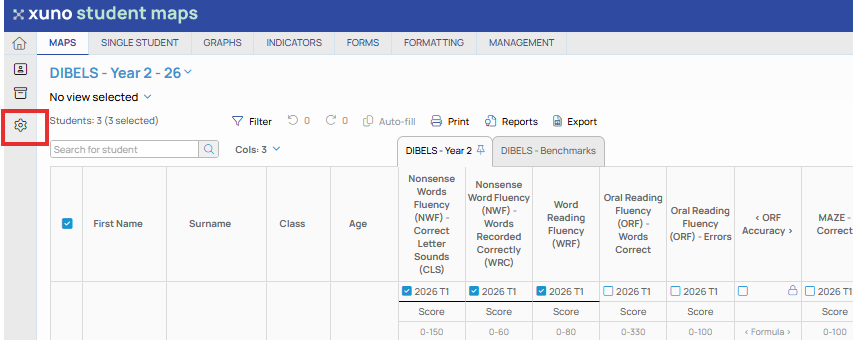
• To display the list of all maps set up at your school, click the gear icon next to the map name in the top left of the screen.
• If this icon is not visible, either you do not have sufficient access rights to be able to create or edit maps (set up in GradeXpert desktop application), or this feature has not yet been enabled at your school (contact support to assist).
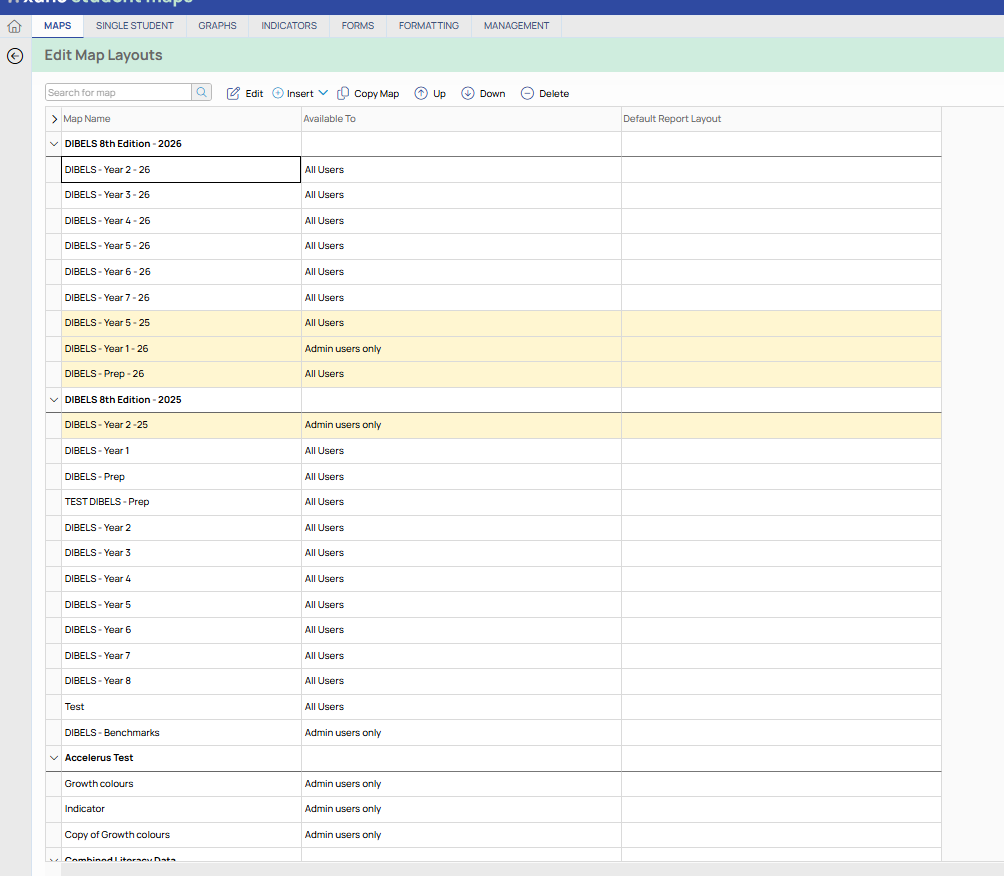
• Clicking this icon will open the Map List, displaying all maps that exist in your database. The map you currently have open on the previous page will be selected by default, meaning you don’t have to search for the current map in order to edit the layout of that map.
• The map list shows all maps set up in your database, organised under map groups. The users that have access to each map are shown in the “Available To” column, and if a default report design has been linked to a map, it will be shown in the “Default Report Layout” column.
Create a New Map Group
Individual maps are organised into groups. You can create new map groups as needed and move any existing map into any group.
This makes it easier to manage your maps, as similar maps can be grouped within a specific map group (e.g. all report maps for 2023 semester 1 for different year levels can be grouped under a “Report Maps for 2023 semester 1” map group).
• Map groups are shown in the map list in bold text. Maps are shown in non-bold text. You can expand or collapse any or all map groups by clicking the arrow to the left of the map group name.
• You can collapse or expand the whole map list by clicking the Collapse or Expand button above the map list.
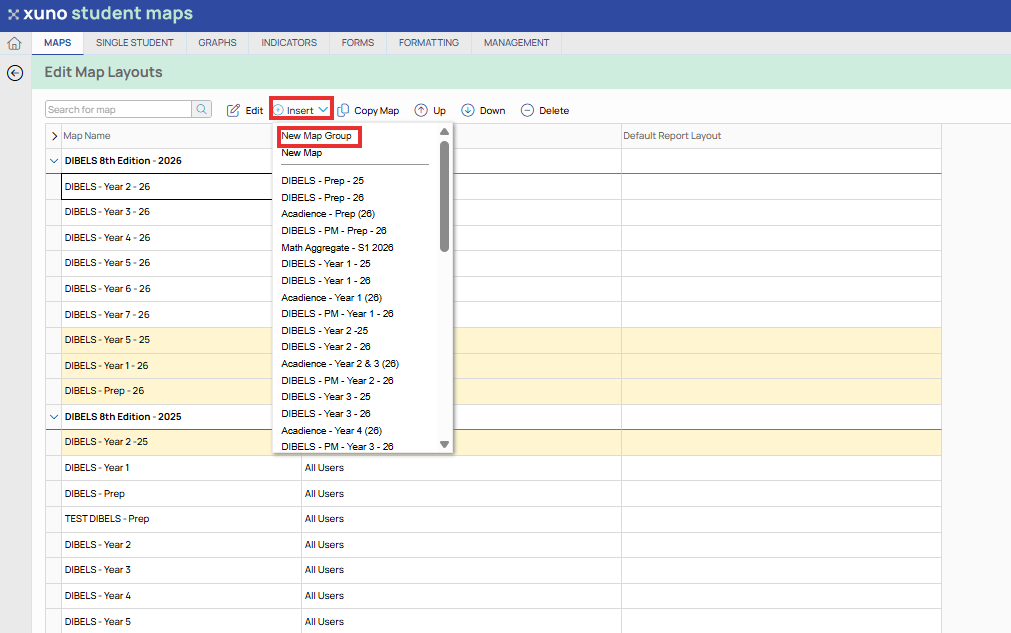
• To create a new map group, which will be added at the end of the list by default, click the Insert drop-down button above the map list, and select New Map Group.
• A new row will be added to the map list at the end of the list, with a default map group name of “New Map Group 1”. You can now rename the new map group or add new maps under that group, or move existing maps into that group.
Rename Map Group
Renaming a map group from the default new map group name, or from an existing map group name, is done by pressing Space bar in the map group name cell (i.e. bold text) and typing in the desired map group name. The updated name is saved when you move off that cell.
Reorder Maps
Maps and map groups can be reordered, so that existing maps can be moved into different map groups, and whole map groups can be moved up or down the list in a single action, without having to move all maps individually within that group. This is useful when you want less used maps to be shown at the end of the list, and more frequently used maps to be shown at the top of the list, ensuring users don’t have to scroll to the bottom of the list to find a new map.
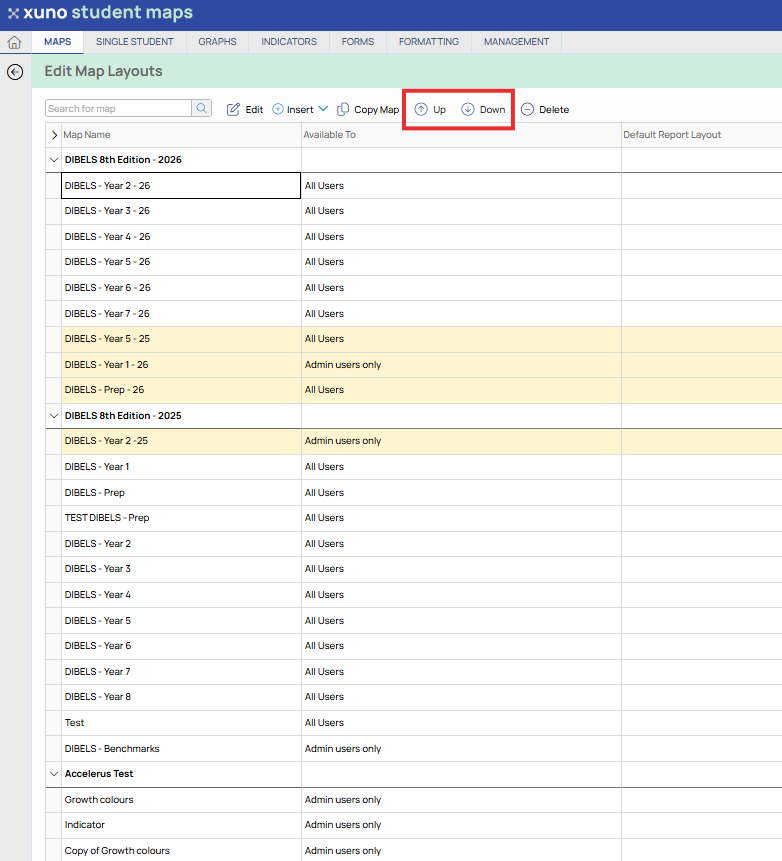
• To move an individual map, click once on that map name in the list to select that row, then click the Up or Down buttons above the map list to move that map up or down.
• If the map reaches the end of a group and you click the Down button again, it will be moved into the next group, which also happens when moving a map up.
• To move a whole map group, and all maps within that group, click once on that map group name in the list to select that row, then click the Up or Down buttons above the map list to move that map group and all maps within the group up or down the list.
Delete Maps
An important difference between deleting a map and deleting an Excel file is that when you delete an Excel file, all data in that file is also deleted as the data is saved in the Excel file itself. When deleting a map, only the view of that map data is deleted, no actual results/comments/attachments are deleted. This means you can delete and recreate maps as needed, and the data that is saved in the background against individual students will be visible once the map is recreated.
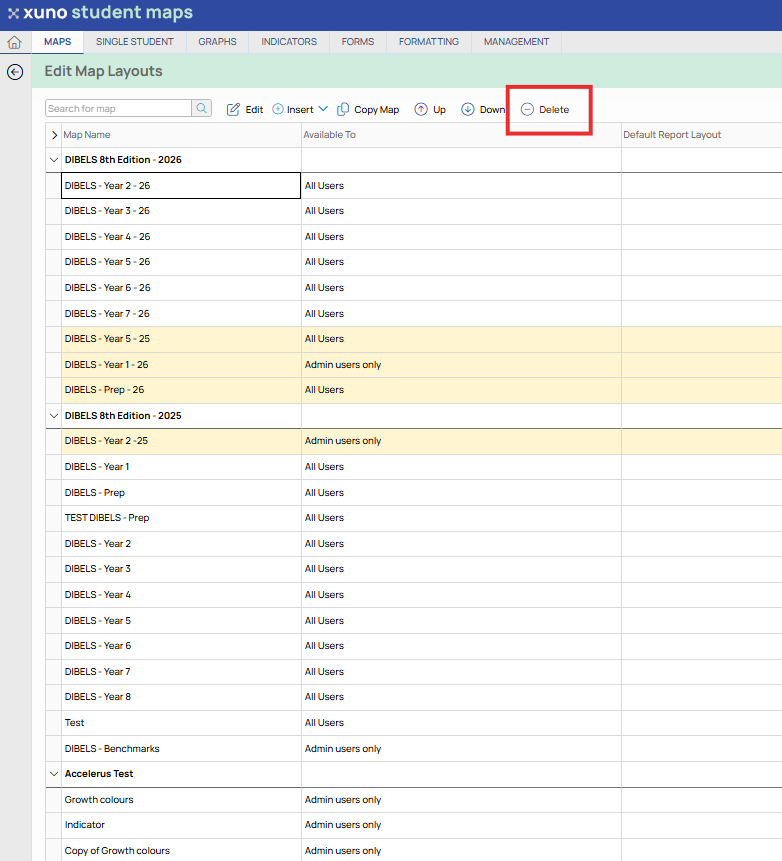
• To delete a map, click on the map name to delete, and click the Delete button above the map list. You will be prompted to confirm the deletion, and the map will then be permanently removed from the list of maps. If you deleted the map in error, you would need to recreate it from scratch as there is no undo function for deleting maps.
• To delete a map group, click on the map group name to delete, and click the Delete button above the map list. You will be prompted to confirm the deletion, and the map group will be removed from the list.
• Any maps within that group are not deleted, just the map group name. Any maps within that deleted group will then become part of the map group above.
Copy Map
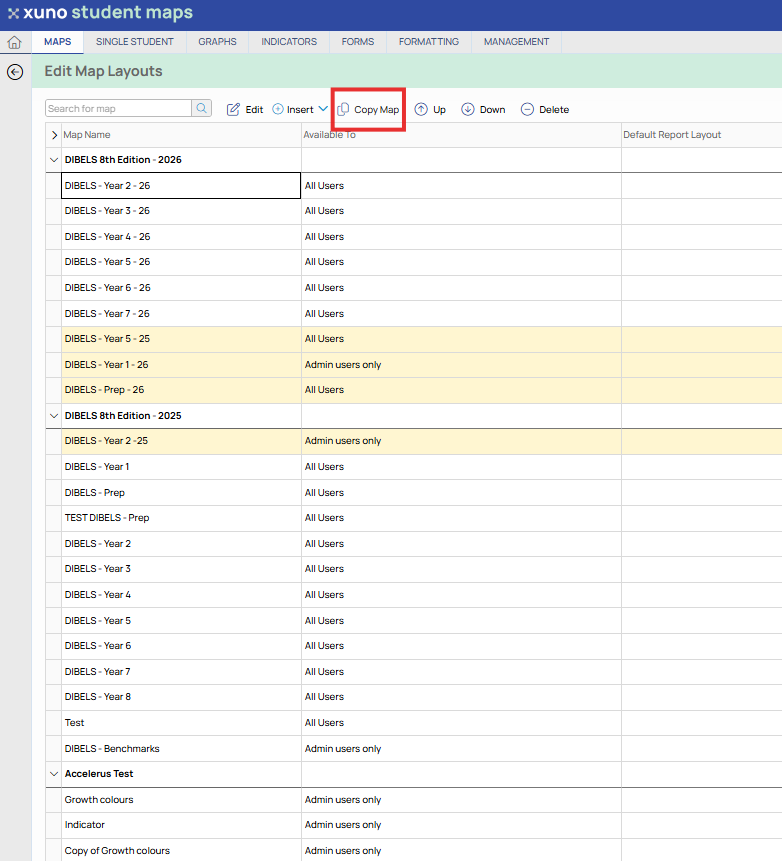
You can create a duplicate of an existing map by clicking on the map name to copy, and then clicking the Copy Map button above the map list.
• This will then insert a copy of the selected with the same name but adding the words “Copy of” to the front of the name. • All the details from the original map are copied, including which staff members can access the map, the default report layout to use (if any), and all pages and columns of the map.
• You can then rename or edit this copied map layout as needed.
Search for Maps
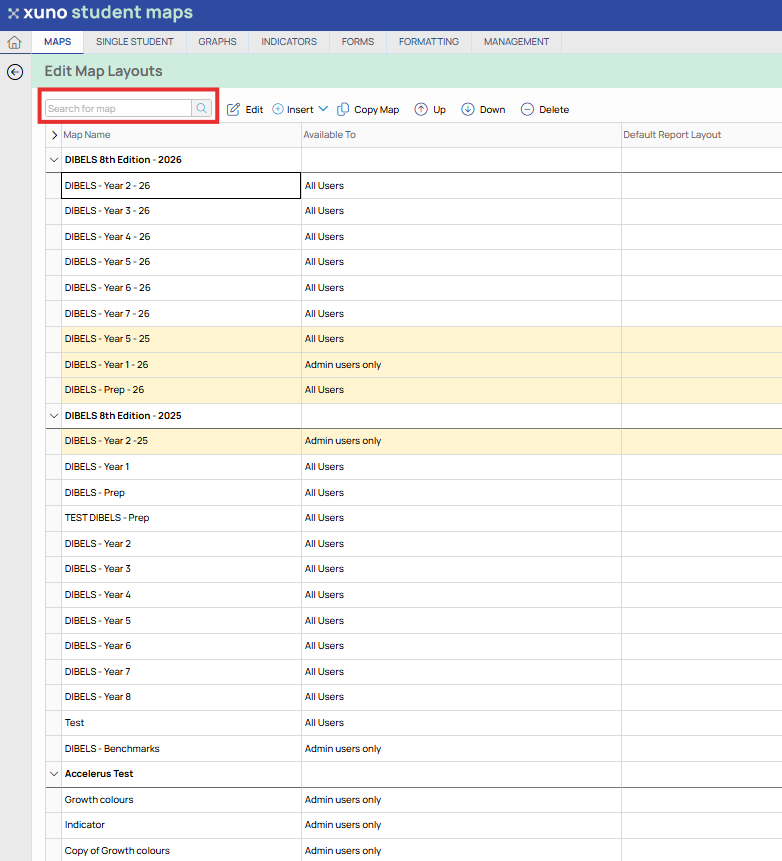
If you have a large number of maps in your list, you can search for any map or map group by typing any part of the map name or map group name into the Search for map box.
• You can type any part of a map name or map group name into the Search box. Press Enter or click the magnifying class icon to start the search.
• Any maps or map groups that contain the search term will then be displayed. If a map group is shown after searching, then all maps within that group will be shown as well.
• To clear the search and show all maps in the list, click the X in the search box or remove all text in the search box and press Enter.
Return to Student Map
• When you have finished creating or editing map layouts, click the Maps button in the top left corner to return to the map you were using.
• This will then reload the map you were previously using, including any changes made in the current map layout.
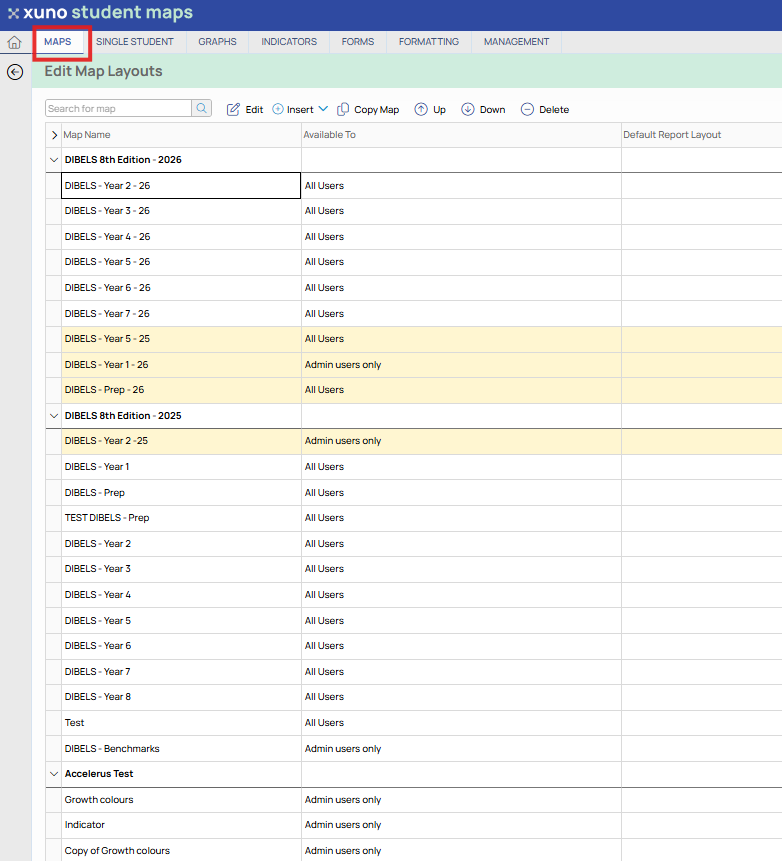
Create a New Map
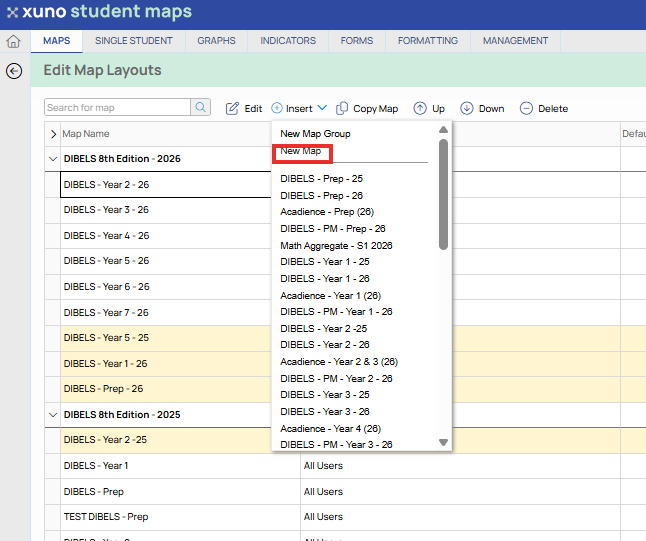
• To create a new map layout, move to the row in the list where you want the new map to be added, click the Insert drop-down button above the map list and click New Map.
• You will then be taken to the new map page, where you first need to give the new map a meaningful name in the Map Name box.
Map Settings
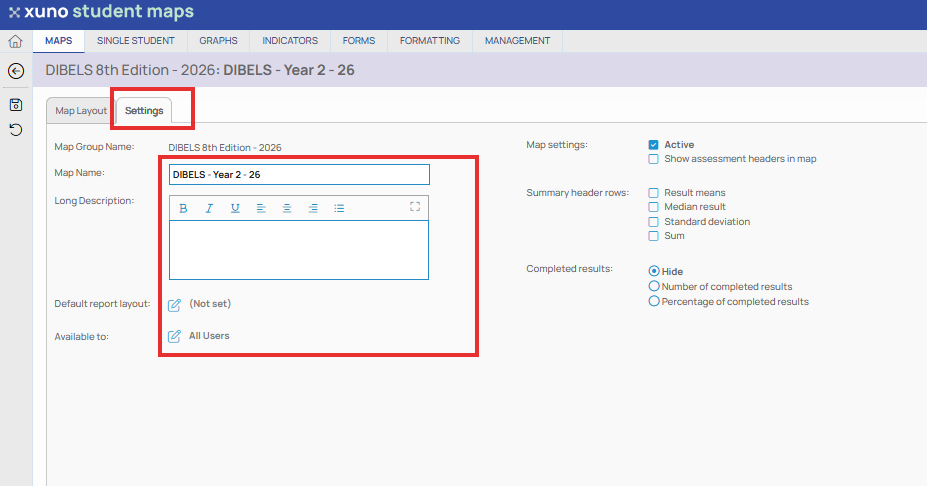
Whether you are creating a new map or editing an existing map, you can update the settings for this map in the Settings tab of each map.
Rename Maps
• Rename maps by changing the map name in the Map Name box on the Settings tab.
• Duplicate map names are not allowed, and you will be alerted if a duplicate is found.
Long Description
• You can add in an extended description of this map in the Long Description box.
Default Report Layout
• If you have created a report layout in the GradeXpert desktop application that must be used as the default report layout when this map is used and user clicks Print Report, select this default report layout by clicking the select icon and choosing the desired default report layout.
• This means that when a report is generated, this report layout is used by default. You can still select a different report layout when printing a report, this just makes it easier to ensure the correct layout is used when printing reports for this map only.
• Leave this option blank (not set) if no default report layout is needed for this map.
Map Available To
• You can give access to specific maps to specific users or groups of users. This ensures that users only see maps they require, instead of the whole list of available maps, making it easier to find the maps and data they require.
• Click the select icon next to “Available To”, and select which users will be able to open this map. If they are not selected, then this map will not be visible or available for selection by those users.
• You can select All Users, Admin Users only or individual users by choosing one of these options at the bottom of the list.
• Selecting All Users will make this map available to all Student Maps users.
• Selecting Admin Users Only will make this map available to Student Maps users with an access level of 3 set up in the GradeXpert desktop application.
• Selecting Selected users will allow you to tick individual users from the list, or user groups (which will include all users in that user group, set up in the GradeXpert desktop application).
Making Maps Active or Inactive
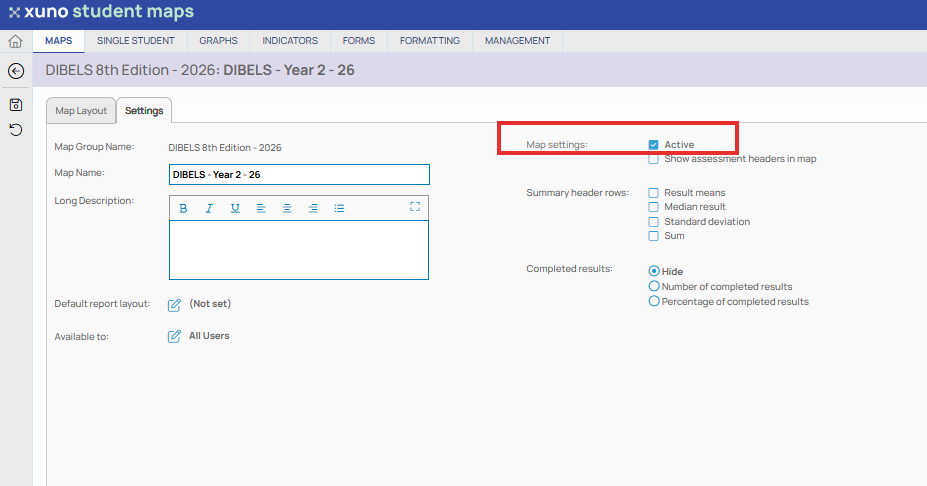
New maps are inactive by default. This means they won’t be shown to users for selection, even if that user is in the Available To list.
• Maps are usually made inactive when you no longer use the map but want to keep the map layout in your list for future reference.
• Tick the Active checkbox to make a map active (only possible if at least one page and assessment exists in the map).
• Untick the Active checkbox to ensure this map is not shown to any users, even if they are in the Available To list.
• Inactive maps are shown in light grey in the map list when editing map layouts.
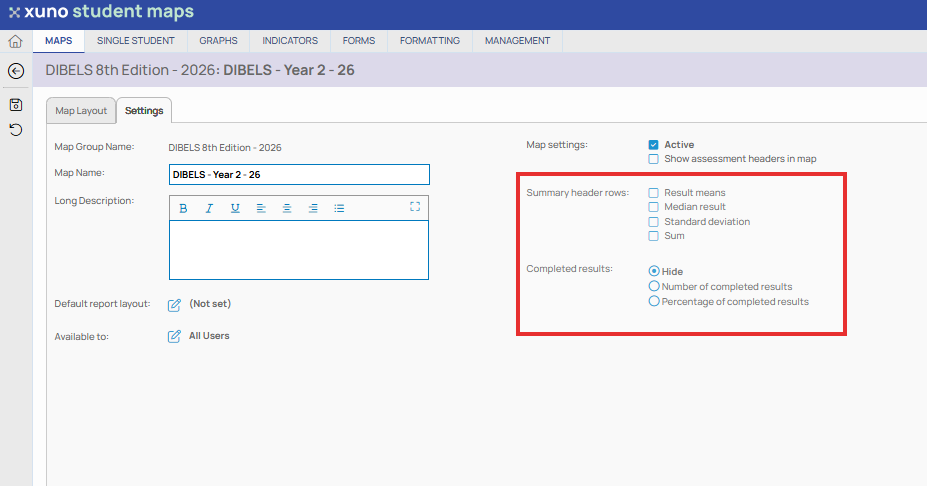
Summary Header Rows
When a map is displayed, you can choose to include any combination of summarized data at the top of each column. These selections apply to all columns in the current map.
• Select Result means to show the mean (average) result of all the assessment results in the selected column.
• Select Median result to show the median (middle) result of all the assessment results in the selected column.
• Select Standard deviation to show the standard deviation of all the assessment results in the selected column. A standard deviation is a measure of how dispersed the data is in relation to the mean (average). Low standard deviation means data are clustered around the mean, and high standard deviation indicates data are more spread out.
• Select Sum to show the sum (total) of all the assessment results in the selected column.
Completed Results
When using maps for student reporting data entry, it is useful to be able to see how much data for each student has been entered, and how much data still needs to be entered. This can easily be done using the Completed results option.
• Select Hide to prevent the display of the number of results entered into a map.
• Select Number of completed results to display the number of results entered for that student compared to the total number of results expected to be entered, e.g. 32/40 (32 out of 40 results have been entered).
• Select Percentage of completed results to display the percentage of results entered for that student, e.g. 60% (i.e. 60% of results have been entered).
• The total number of results required is based only on the total number of editable columns in the whole map. Read-only columns, including indicators, real-time attendance etc. are not included in the total count of columns of data required to be entered.